
As those of you who read my bullet journal posts will likely know, I keep a record in my BuJo of the titles of the books I read each month and give them a rating out of five hearts. This is so I know which novels and non-fiction books I’ve read in January, February and so on. It also means that, if I wanted, I could count up my total for the year. I use a simple design so it’s quick to set up and takes minimal time and effort to fill in. However, this week, I was introduced to a cool app called StoryGraph on which you can log all of your books, add a rating, identify the reading format (e.g. digital, paperback or audio) and much more. And as well as being a great resource to keep a record of your reading, it’s super easy to use so I’m already hooked! Today, I thought I’d share some of the many features of the StoryGraph app so you can decide if it’s something you would be interested in using too. As well as there being an Android and iOS, there’s also a desktop version which you can log into using the details you set up on your phone.
Adding books already read
After signing up for an account, which required an email address, username and password, I started to add all of the books I’ve so far read this year by referring back to my current and previous bullet journal. This was quick and easy to do, using the ‘Search all books’ bar at the top of the home screen and selecting ‘read’ from the drop down. What I wish I’d known from the start, is that you can select the format of the book (hardback, paperback, digital – for me Kindle, or audio book) by clicking on the word ‘editions’ (which is underlined) when you’ve found your book. If you go into preferences, you can also default to your preferred format by choosing from the drop down menu – mine is set to digital as I mainly read on my Kindle.
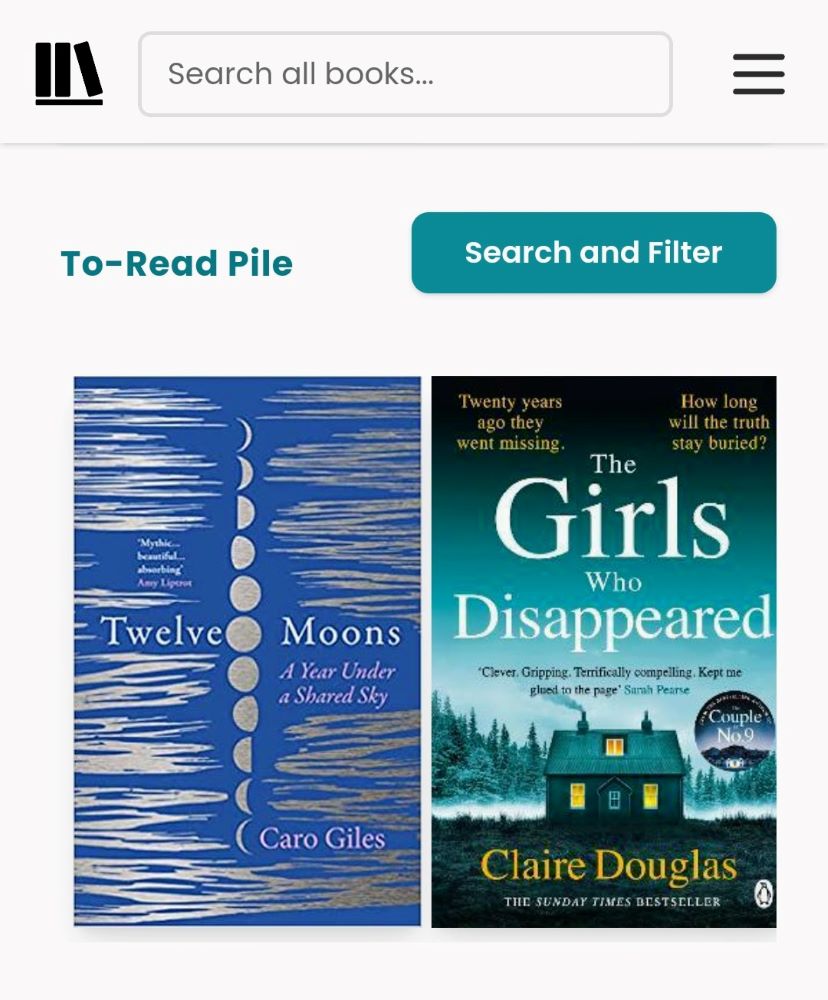
Creating a To Be Read pile (or virtual bookshelf)
This is something I’ve done before by sticking mini book pictures into my bullet journal but, as you can imagine, it’s quite a time consuming spread to make. In Storygraph, you just search by title, select from the available editions and then select ‘To read’ from the drop down menu and it will appear on your shelf which you can swipe along to view more.
Logging the books you are currently reading
You identify the book or books you are currently reading, you can either select from your TBR list or search for the titles and select ‘currently reading’ from the drop down menu. If you want to see how long it takes you to read a particular book, you can record the start date and click on ‘mark as finished when you’re done. Of course it’s up to you what kind of details you want to add but the more you log, the more interesting and in depth your statistics will be.

When you finish reading something, you are given the option of adding a rating, a review and key information about the book (including themes and pace). The rating system allows you to get really precise so rather than 4 out of 5, you can choose 4, 4.25, 4.5 and so on. You can then check the average rating out of 5 which you could use to inform your book choices in the future.
Viewing your ‘Reading Journal’
This part of the app contains all the information about your recent reads and the start and end dates if you entered them. The further you scroll, the further back the information goes. At the end, it shows any books that you didn’t enter start and end dates for.
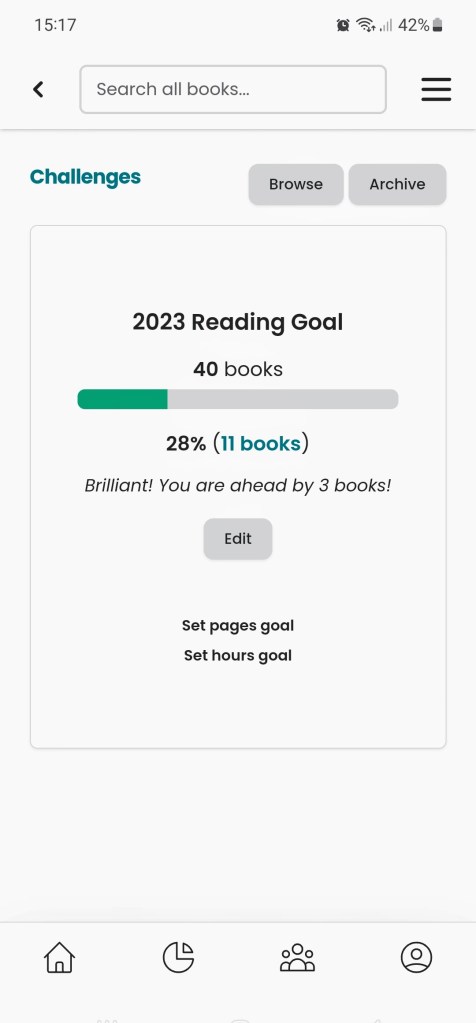
Setting up a reading challenge and checking on your progress towards it
This is completely optional but a nice little feature which can be accessed by clicking on the profile button shown on the right, then the three lines in the top right corner, followed by ‘reading challenges’. You can set goals for reading a particular number of books, number of pages read or hours spent reading (this one would involve you entering the data for this). I chose to set myself a goal of reading 40 books this year and you can see my progress on the screenshot below.
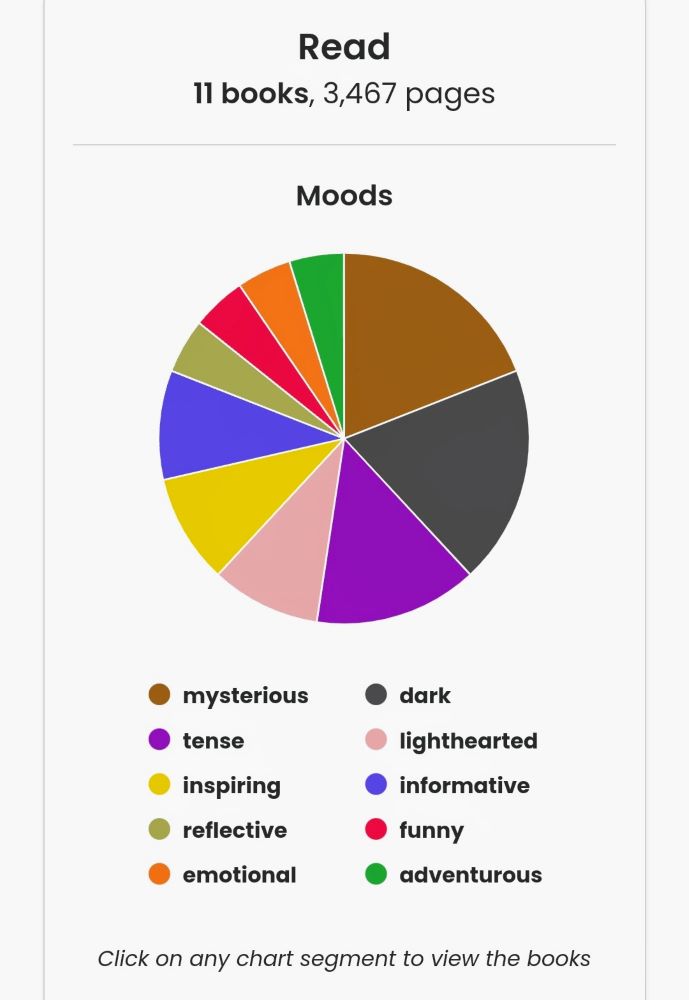
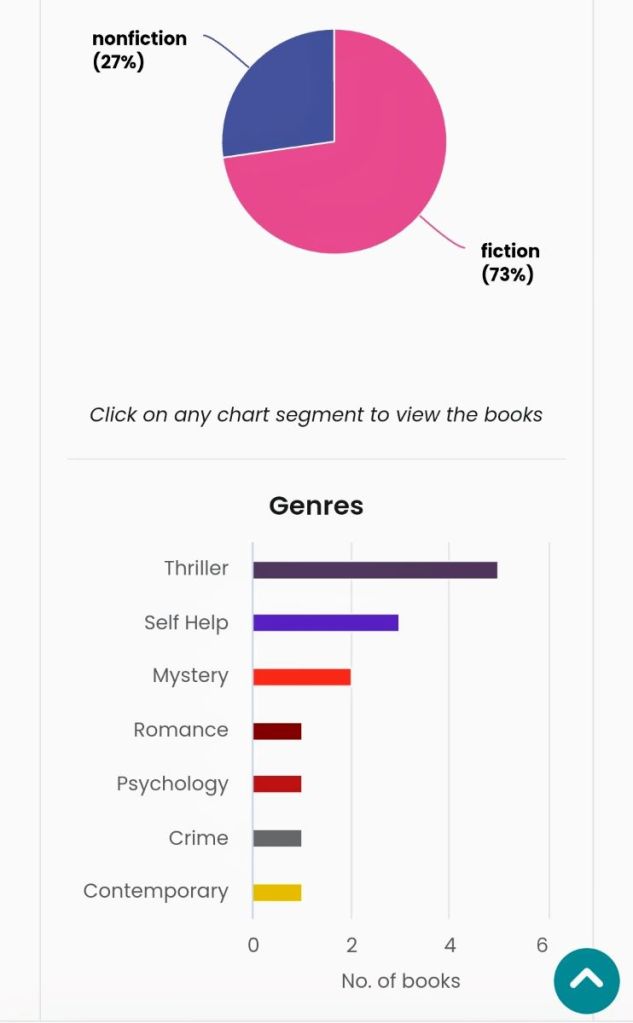
Viewing your reading statistics
Your current reading statistics can be viewed by clicking on the pie icon at the bottom of your screen. The data is generated from the information which was included when you selected your edition of each of your books and includes details such as the mood of the books you’ve read, how many pages your books tend to have, your percentages of fiction and non-fiction read, plus the different genres of your texts (and more!). Here’s some examples of my information as screenshots.
Final thoughts…
So far, I’ve only entered my book reading information from January 2023 but I’m amazed by the interesting statistics that can be viewed from fairly limited data. I might be tempted to print out screenshots of some of the graphs and pie charts to add to my bullet journal in the future, possibly halfway through the year or at the end of 2023. As I’ve only been using the app for less than a week, there’s quite a few more features which I haven’t yet used so haven’t discussed in today’s post. So far though, I’m really enjoying using it and learning more about what it can do.
Have you tried StoryGraph already or is it something you might like to try? Let me know if you have any question about the app or if you get stuck with any of the basic features if you give it a go. As I said, I wished I’d known about selecting from the different editions from the start.
Happy reading!


One thought on “I joined StoryGraph and I absolutely love it!”